As previously discussed, the positions were opened at the opening price... they are the following:
- CBST $20.85
- GHM $14.44
- DECK $83.89
- CEU $5.50
- PPD $52.20
- MHP $24.32
- KBR $23.00
Wednesday, September 30, 2009
Monday, September 28, 2009
Let's make some money... (I hope)
The stocks bought a year ago are now sold. Now it's time to look for new companies... In the portfolio, there are 30,501 USD available to put into new shares. So we'll aim for 7 stocks equally distributed, which will make a portfolio of 28 in the end.

The new companies being bought at the open tomorrow, are as follow:
- CBST
- GHM
- DECK
- CEU
- PPD
- MHP
- KBR
Remember this strategy is based on quartiles and deciles, meaning that running a screener these are the best 5% stocks of the entire NYSE sample, so in theory they should outperform their peers, meaning lose less if the markets as a general falls and gain more as the market rises. I tried to maintain a 50/50 approach of small/mid caps vs. big cap companies. I also made sure I didn't concentrate in the same industry. Ok that's it. 15 minutes "wasted" to choose these companies. Now we have to wait until December 26th ;)
I'm very tired today so I'm going to rest in my coffin as the vampire I am. I do need my beauty sleep sometimes.
Cheers,
Sal
LMT
Since the 26th fell on a weekend, we will sell the shares today at closing price. The new companies that will be part of the portfolio will be announced today, and will be bought at tomorrow's open price
Saturday, September 26, 2009

Friday, September 25, 2009
Bull Spanking Friday
It's been a nice couple days indeed, I hope everyone got in time when I made the "emergency" post at around 107x's points in S&P.
We are dangerously approaching to the bottom line of the wedge. Once it breaks, it's sayonara bulls. So far, it sure looks promising but let's keep composure because the bulls can ramp this thing up.
Although I admit I'd love it to be the top... wouldn't it be nice?
By the way to everyone who thinks Fibonacci, EW wave, and EW time projections --> PRESS HERE
Anything curious in there? Let me quote:
BTW there are 2 poll questions going on... please participate, since I'd like to know your opinions regarding the matter
Also stay tuned for the update on LMT Portfolio and the new stocks we'll buy on Monday.
We are dangerously approaching to the bottom line of the wedge. Once it breaks, it's sayonara bulls. So far, it sure looks promising but let's keep composure because the bulls can ramp this thing up.
Although I admit I'd love it to be the top... wouldn't it be nice?
By the way to everyone who thinks Fibonacci, EW wave, and EW time projections --> PRESS HERE
Anything curious in there? Let me quote:
Fibonacci 38.2% correction would be a rally of 28 weeks, putting a target in September 20th-23th as a time window for a top. Although wave structure is more important than time relationships, but these help us figure where a top may lay in. These same methods indicated a time window for a bottom back in March in the 9th-12th day of that month. We know how the story ended.Bullseye ;)
BTW there are 2 poll questions going on... please participate, since I'd like to know your opinions regarding the matter
Also stay tuned for the update on LMT Portfolio and the new stocks we'll buy on Monday.
Thursday, September 24, 2009
India Recap
Regarding India I don't have the Sensex on the database of this program, so the next thing most similar is the ETF's in this case MSCI India.

So far so good...
Regarding the last post, here it is one of the best performers from the list of the screening tool... It issue a buy at 0.57 USD at it stands today at 13.22 USD, a 2219% rise!
I know that in hindsight is easy, but with the screening tool and with the system we'll have the chances from time to time to grab these suckers. Even if it only happens once in 10 or more years I'd be more than happy.

Screening tool
For the more aggressive portfolio - where the holding period is shorter and also we short stocks - I have been trying to work on some screeners to scan the entire NYSE, AMEX and NASDAQ universe so that they fit the criteria...
With that in mind, here are some results from the Beta version of the screening tool


With that in mind, here are some results from the Beta version of the screening tool


While this screener is only as of today only technical, I do intend for long positions to make a cross from this screener with the screener of LMT portfolio... that would be the cherry on the top of the cake. Finding good fundamental companies and then with the help of the system buying them on strength... who knows, with good fundamental companies the program may issue a buy signal and never issuing a sell signal until 2000% or more.This should work as a powerful combo...
Wednesday, September 23, 2009
Do you hear the dulldroms?
Just a brief update...
I've been bearish since the 1032... today with the move up to 1080 points in S&P, followed by a strong reversal to me may be the end of P2 finally.
I count 5 waves since the 977, and the swing from 1055 to 1080 (constituting wave 5) I also count 5 subwaves.
The super dupper bullish sentiment, allied with strong resistances, the fact the market is broken (Nasdaq making new highs, and DOW and S&P lagging way behind) and with this strong reversal leads me to think of a blow off top. I actually entered short at 1080, with a stop above 1100... but if we close down strong I may already lower my stop
I'll make a follow up post tonight

Tuesday, September 22, 2009
India Sensex

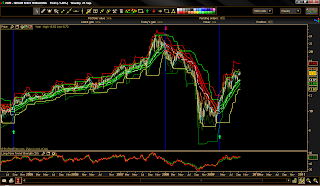
The so much awaited Sensex from India. Not much has changed in my opinion, the only doubts surfacing from the chart is whether Wave iii is extending or not... Since my opinion is we're in a bull market, and the waves support that stance and bull markets tend to surprise us for the upside, just as much when in bears anything can happen to the downside.
Just take a look at the huge gap up in May. From the waves I thought at the time we probably were going to have a little correction since the structure had the minimum requirements of completion, but then subwave iii extended... so it's just to say in bull markets surprises on the upside are common so I favour a bit the overextension count... This bull has a loooooooong way to run.
Even if you're not fan of EW just look at the price... that thing is screaming bull market, the trend is up, just follow the trend.
Also, please refer to the chart I posted almost 6 months ago:

So far, it's moving in tandem, and beware this last chart is just a rough estimation since the presentation is a bit poor... The conclusion is, once we finish subwave 1 and correct for subwave 2 and start subwave 3 that should become the strongest and healthier period of this market. It will be a 3rd of a 3rd wave the most powerful wave combo.
Friday, September 18, 2009
1920's Dow versus 2000's Nasdaq
I found this really amazing chart between the two indices. As you know, a lot of people were/are making correlations to 1938 bear... And I actually was one of the first stating if the fractal did work we would easily go to 1000-1100 points in S&P
See here: http://jogarembolsa.blogspot.com/2009_03_01_archive.html it's the first graph
See the correlation?
Well this next chart that I spent the last few hours analysing shows a fractal, a really long term one, of Dow in the 1920's until 1940's and the Nasdaq.
Why the correlation you ask? I see the Nasdaq as the soaring Dow of the 20's. At that time, the Dow was the main index, where the speculation money and the speculation stocks were traded. Railroad stocks, oil industry and real estate, etc.
Well, roll forward to the 1990's... What was the big speculation index and the stocks that most people traded in an Euphoria state of mind such as people did in the 1920's? Exactly, the NASDAQ. Stocks such as GOOG, AMZN, AAPL, BIDU, DELL, the former AOL, etc...

 The 2021 major bottom cycle would be correspondent to the 1949 major low before the big bull move until the 1960's.
This in no way would harm the EW counts, we would just be in a kind of triangle correction for almost 13 years or so (since 2000)
Don't forget the good trader is the one who adapts to new conditions and makes use of new information... P3 may well happen, it may not as well, so I'm putting this on the table.
To me these are now the 2 top viable paths. Either a P3 or a triangle, either way bull market this is not...
I'll see you on the other side..
EDIT: Also if correlations maintain a top would be in the cards around October 10th, is there any phi turn date or anything relevant around that date?
See here: http://jogarembolsa.blogspot.com/2009_03_01_archive.html it's the first graph
See the correlation?
Well this next chart that I spent the last few hours analysing shows a fractal, a really long term one, of Dow in the 1920's until 1940's and the Nasdaq.
Why the correlation you ask? I see the Nasdaq as the soaring Dow of the 20's. At that time, the Dow was the main index, where the speculation money and the speculation stocks were traded. Railroad stocks, oil industry and real estate, etc.
Well, roll forward to the 1990's... What was the big speculation index and the stocks that most people traded in an Euphoria state of mind such as people did in the 1920's? Exactly, the NASDAQ. Stocks such as GOOG, AMZN, AAPL, BIDU, DELL, the former AOL, etc...

See all the amazing correlations, regarding time which fit perfectly almost to the day, as well as percentage moves are all pretty much similar.
This would mean that the big drop such as P3 wouldn't be in the cards, although the bear wouldn't be over for almost 4 more years, only ending in 2013 more or less. Instead we'd be stuck in a trading range with a lot of 25+% movements, both up and down and reaching a low in 2013 by testing 2008's bear market lows or breaching them just by a few % points.
Also this would fit nicely with the Benner-Fibonacci Cycle Model that I posted a while back.

This in no way would harm the EW counts, we would just be in a kind of triangle correction for almost 13 years or so (since 2000)
Don't forget the good trader is the one who adapts to new conditions and makes use of new information... P3 may well happen, it may not as well, so I'm putting this on the table.
To me these are now the 2 top viable paths. Either a P3 or a triangle, either way bull market this is not...
I'll see you on the other side..
EDIT: Also if correlations maintain a top would be in the cards around October 10th, is there any phi turn date or anything relevant around that date?
Thursday, September 17, 2009
LMT Portfolio Update
As the date approaches in order for us to decide on new allocations for the portfolio in order to substitute the shares bought during September 2008, see the portfolio on your right side - lateral bar of the blog --->
 Since the last update it really sky rocketed from a 24% return in end of August and now with an almost 37% return. For a low maintenance portfolio such as this, during the middle of one of the biggest financial turmoil in the stock market history I think it's a pretty good return. And we're beating the S&P by a 46% points margin...
Since the inception portfolio is up +37% vs. S&P - 10%

Since the inception portfolio is up +37% vs. S&P - 10%
Thursday, September 10, 2009
Ameros
With so much talk about new currencies... Ameros, new world order currency bla bla... I am more than ever convinced the USD will rally from around these levels... it's become a herd trade the demise of the dollar. When did you see the market do what the most expect? I haven't... I see the demise of the dollar in the future perhaps but that will happen when most won't see it coming...
I find it very difficult the average joe shmoe or the shoeshine boy to be exchanging their dollars for foreign currencies and gold and silver and ending up being right...
That would be a first...
You know what my EW stands on USD that this is wave 5 of final C down... but today I just keep normal standard TA. From shorter time frame to the biggest - weekly charts for me work so well... some nice supports showing there...


UN report to replace the dollar


P.S.: I thank everyone for the kind words of support...
Wednesday, September 9, 2009
Hiatus
Due to health issues within my family I will not be able to post during the next times (1 or 2 weeks I think).
The dollar made a new low and I think is making a bullish wedge... also until it breaks this resistance line there will not be confirmation... Once it breaks (not a matter of IF but of WHEN in my opinion) it should accelerate upwards...

Best.
Sal
The dollar made a new low and I think is making a bullish wedge... also until it breaks this resistance line there will not be confirmation... Once it breaks (not a matter of IF but of WHEN in my opinion) it should accelerate upwards...

Best.
Sal
Tuesday, September 1, 2009

Loomy September
Not to pat my self on the back but...

I nailed it pretty much... ehehe
Now I'm not saying this was the top, there are still alternatives as to this being only a correction, but in my opinion the steepeness of the decline, and the looks of the structure seem impulsive to me so the odds favour we've topped.
Once we reach and breach the 980 mark we can say with more certainty and put the alternatives in the trash, that we topped.
In other news, you may have noted the LMT Portfolio on your left and the Forex account. LMT portfolio is a long only stock portfolio where I intend to beat the S&P year over year. It's low maintenance because we only buy stocks every Quarter around 5-6 stocks where we can have a maximum of 30 stock in the portfolio.
I started this for my private use last September (2008) and you can see how it has beaten the S&P by a large margin, it even had a 20%+ return for the past 12 months despite the chaos in the markets.
I guess not many people can say the same for the last 12 months with such a low maintenance strategy and such passive approach.
Then we have the FX account. This is a live statement of one of my accounts which I funded with 1750 USD. My intention is to grab around 20,000 USD in 12 months... daytrading of course...but even that will be quite passive as well... a maximum 2 trade per day so it isn't such an active approach.
Please keep visiting this blog because enhancements will be made soon...
Subscribe to:
Posts (Atom)