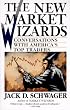
We are at an important juncture... I think the wave patterns are pretty clear in this graph. You can see a lot of textbook 5 wave declines, even at lower degrees that are not labeled on the graph, but if you pay attention, especially wave degrees lower than the pink waves, you can see also 5 waves mostly between waves pink ii and iii.
Fractals working at their best. So, we are now at a possible juncture to a new degree third wave, in which case if it happens we should go much lower...