Subscribe Now

Showing posts with label SP500. Show all posts

Wednesday, June 30, 2010

LMP Update v2

We are still postponing the purchase of the new companies, which still weren't announced. They will be soon.

Apart from that, the portfolio is doing wonders so to speak. The last batch of stocks that that were bought a year ago, and sold yesterday, the average return translated into +18% (not including dividends) while the S&P during the same time period (June 2009 - June 2010) made +12.5%.

Of the 6 stocks though, the outperformance clearly came from 2 companies only, but that is to be expected. Some will underperform (usually the majority) while a couple ones will make heavy over performance covering all the underperformance of the other stocks and then some making it possible to beat the market.

Also I'm glad we did make the change on the strategy as well. The hedging part of our portfolio, where I use a longer term version of "Zé Manel" serving as an overlay to neutral our portfolio by shorting the market as a whole, while keeping our beloved stocks. Since we first started this overlay, our overperformance increased from +46% to +60%  as of today !

 This means that our stocks as a whole have been falling less than the market as a whole, and at times even being able to make a bit of money. Of course under this strategy the goal is not to make money, but to hedge our portfolio of market risk and to maintain our gains and for us to be dependent on our stock picks exclusively.

For example, today which was a down day for the market with more than 1% down, we actually managed to gain a few dollars with an up day of our portfolio of +0.50% ... I wish all days could be like this :) it won't... but we should keep our eyes on the big picture, and I believe we really do have a winning strategy here

EDIT: The portfolio as of today

Tuesday, May 18, 2010

Today's high...

...1149 points !
Should I make a little mind refresher?


That was last night...(apart from the "Today's high" stuff)... how can some academics say the market is random is beyond me. It's not. It's probabilistically predictable... But academics keep talking, while real people keep making money in the markets... who would you rather listen to? Sigh...

Monday, May 17, 2010

Wave 3 impending?

As for the S&P 500 here's an update:

 We are at an important juncture... I think the wave patterns are pretty clear in this graph. You can see a lot of textbook 5 wave declines, even at lower degrees that are not labeled on the graph, but if you pay attention, especially wave degrees lower than the pink waves, you can see also 5 waves mostly between waves pink ii and iii.

Fractals working at their best. So, we are now at a possible juncture to a new degree third wave, in which case if it happens we should go much lower...

Saturday, March 27, 2010

Big Update

Hello Hello fellas...

It's been a long time since a proper update on the blog, but it has been very hard to keep up with everything going on. Today I will make a proper update starting from our little portfolio which we can say is in good health, to currencies, stock market, commodities and what can we expect from here on.

So let's start with our portfolio:

This one looks to be a very hard task, I have a few ideas on my mind and some of our current positions appear in the screener once again, so it will be more cumbersome to me, since I had to go through their graphs to see which ones could offer more potential. The fact that the market is deeply overbought makes the timing of our purchase to be very poor. I will present some facts further down the road, to see if we press the trigger on Monday or not.

Here is the current state of the portfolio:


Well the stocks that are up for a switch and their respective returns since we've bought them are the following:

- IPHS   +141%
- NOV   +19%
- DIVX  +45%
- COH   +134%
- MOS   +29%
- DELL   +45%

So, these stocks have served us well especially IPHS and COH, but it will be time to sell them now except for Coach (COH). This one I still like it.

The new contenders for the next year should be:

- WTW
- APOL
- FWLT
- SOLR
- SOHU
- COH (which we already have in the portfolio).

Now the thing is, the first group of stocks are to be sold at the opening of Monday. I will not buy the the new contenders right away and why is that?

Because the market is extremely overbought and in my opinion a correction is due next week at least, so I will be waiting a bit to see if the market drops. In terms of S&P the readings are in the extremes, and nothing goes up in a straight manner of course.

Here is a signal that has served well in the past months and is now triggering a potential top:


Every time the conditions on volatility crossed over its' MA it was a top before a mild or even a stronger correction.

Regarding the Dollar, everything is going acording to plan. The dollar has been rising relentlessly against pretty much every currency. The scenario I traced out almost a year ago has been such a very good road map for us:


Now, the thing is, I see this rally hitting a mid-term top. I can already count 5 waves up of the same degree so it may be time for a little bit of a rest on the Dollar. As you can see the EW structure since the bottom is textbook clear:


The same goes for Eurodollar, which pretty much is the Dollar Index chart but inverted:


The idea to remain is the trend is clearly down for Euro and other currencies against the dollar. The pundits that keep saying how the dollar is doomed i bet they are scratching their heads, and of course they are blaming this due to Greece problems. The fact is the one who makes the news is the market, not the other way around. I didn't even dream of bailouts, IMF's, PIGS and Greece almost a year ago, and yet the dollar is behaving pretty much the way i said it to be in terms of structure, price action, etc... of course they will keep putting the blame into Greece, etc. We of course know better :-)


This chart if I remember correctly was made in July 2009. The green up arrow is the red (1) wave from the updated dollar index chart. As for very long-term we still can't know for sure if this is a rally just to test the 100 area or if it is a new bull long term bull market. As time goes by, we should know that more along the way as we get closer to the inflection points:


This is all for now. Tomorrow will be sky diving day :-D

So if you hear nothing from me the next week or so, it's because my parachute didn't open.

Tuesday, February 23, 2010

Soylent Red

Today's large downside move seems to be the next down move as said on last post. At the time, there were 2 cases made, one for an immediate decline from the 1070'ish levels, or a bounce up to 1110'ish and then a fall.

At the time it made a perfect sense to consider the immediate decline, since the possibility was big for it to happen. I ended up wrong, since that was my principal count, but soon the market gave indication that the alternative count was the one to follow. I got stopped out and since I don't play against the trend it was time to wait for the inflection point to be hit, in this case 1104 which is where I'm short from.

This, if indeed is the resume of the decline, will make leeway down to 993 pts on S&P more or less. Volatility should start increasing.

Confirmation of this scenario will come once we break 1070'ish. Now it's just a matter to sit back, relax and let the market do its' thing.

Friday, February 12, 2010

Tiny update

Not much has been going on the markets lately... it's been boring with this sort of sideways/consolidation range.

There are a few alternatives on the table that I think may be going on. Either this wave down is subdividing and we are up for a few fireworks next week, or the bounce still has some more powder left.

We have to let the market show us the path, there are times where the patterns are clear as water and we have to take action in order to take advantage of them, there are others where it's a bit fuzzy of where we are in the general scheme. These are when we should be out, waiting for the market to clear itself.


As for the US Dollar, the trend remains clearly up. Wave 3 is subdividing so I think we still have some more upside to go before a more meaningful correction, although corrections can be pretty shallow. Remember what I've said, when the larger degree trend is up, surprises happen to the upside, so, our goal is to spot bottoms not tops.


The major signals of Zé Manel on the daily, remain the same. Trend is down. Of course it can always change, but so far my bet is on the short side.

We'll see how next week develops, and I am eager to see how it will fold out

Thursday, February 4, 2010

Portugalmination...

It seems the financial news today are all about my little country... Too bad that the reason for the spotlight to be on us is not for the best reasons, I wish they were... It seems we are now following the footsteps of Greece, and I feel sadness for my country but I have to admit our government sucks really really bad...

Yesterday morning I warned the rollover was imminent in yesterday's post:

http://www.mybullmarket.org/2010/02/bounce-is-on.html

If indeed the indexes are in the wave Î think they are, as I said last week, this decline should be stronger than the last 15 days of January. So be ready...

Wednesday, January 27, 2010

TIIIMBERRRR Version 2.0 - not so fast

As I've said before we needed a new low that sported weakening momentum and strength, characteristics of 5th waves. We have had all that and S&P is at strong support so, in my view of the current price action we should go up correcting this whole move down in a 3 wave fashion (up, down, up).

In my opinion is time to either tighten the stops on positions or liquidate shorts and reverse... or if you don't want to get out of shorts, hedge them with longs.

Here's the intraday graph


Cheers

EDIT:

But even so, one always needs to be careful since the movement can always extend. Nothing is 100%. What we have here is a potential very good risk:return setup based not only on EW but other things such as a cluster of supports, weakening momentum, etc etc.

Friday, January 22, 2010

TIIIIIIMBER

Ouch...

I was expecting a drop but not this hard... I thought the trees were coming down on Monday only. Oh well, better for me... more bling bling to my pocket :-D

Anyways the trend is clearly down still, although it looks like we're having an extension, I think we may have some rebound on Monday or so...

Now, just because I say there might be a rebound (not only just due to EW structure but because this area has a good support) either don't trade a freakin' rebound or use freakin stops !! I say this because someone came up to me a few weeks back saying he lost money on my advice when I said there was a rebound due on EURUSD, when I clearly stated the trend was down and the goal was to spot tops, not bottoms and he went long anyway.

USE STOPS ! No one will be right every time, and most important than stops is money management. Don't be greedy trying to hit the jackpot, trying to nail that one trade that would set you for life: IT WON'T HAPPEN. Work your way up step by step, just like in a staircase fashion.

Good traders think in a perspective of how much one can lose, bad traders always think how much they can win with a certain trade. All you gotta do is take care of your losses, the winning trades and the profits will take care of themselves if you TAKE CARE of your losses. Cut them short !!

There is a saying that goes "Bulls make money, bears make money, greedy pigs get slaughtered...".

To complete, this actually is a good place to go long (both EW and TA call for a short term bottom), as long as a person uses a stop in case this keeps going and going down. There is lot of support here, and as bearish as I can be I'm not blindfolded and don't expect this to break supports at first try.

So, after all this rambling here's the chart...


Thursday, January 21, 2010

SPX Update

This is my short term view for SPX.

The decline is almost a textbook EW form. It should come lower. I'm basing the 4th waves on the alternation rule, but it may instead of a triangle go a little higher. Yet the short term trend is down therefore I'm not interersted in getting long or trying to pick bottoms...

Bumpy ride

Good morning everyone...

Nothing new in markets paradise...oh wait! Wrong...

The dollar is in such a hurry have you seen the index lately?


It is following the path I projected a couple months ago so nicely... for anyone that wasn't watching let me put you up to date...


I also referred a couple months ago, that I believed the US Dollar to have made the bottom while the indexes needed one additional leg up, just like it happened in 2008 but in reverse (the indexes were in wave 1 down while the currencies were still in the 5th wave up).

The same seems to be happening now... Currencies had their way for wave 1 down, while indexes were on their B wave. The 2nd correction wave on currencies matched with the last C wave up of indexes.

Now it seems currencies are beginning their waves 3 (the most powerful in EW terms) while indexes just started to roll over.

It still needs confirmation and the daily trend is still up, but if this carries for more one or two days the trend will definitely will change even on the dailies.

My opinion this may well be an important top. The first target now is around 1100 points on S&P, and at this pace it seems it will reach it quickly.

EURUSD seems to be in a hurry for 1.37'ish...

Tuesday, December 22, 2009

Brief update...

I won't be much active during the holidays. So to most of you I wish you a Merry Christmas and a happy new year.

Let 2010 be full of happy and good things to all of you.

Anyways, I couldn't help myself to not leave here a brief picture on USD Dollar.


As I warned a few weeks back, the trend has changed. In terms of TA we've got all requisites of a trend change, a trend change that EW was long awaiting around the 74 level as I wrote here back in July.

For those that have a short memory: http://www.mybullmarket.org/2009/07/usd-update.html

;-)


 I don't think I got too wrong on it. Let's see how the rest of the prediction rolls out. Which is right here:

 I think a strong bear market rally has started for the US Dollar that will drive it up above their 2008 highs or it could be the beginning's of a new bull market. We'll track it along to see what may be in the cards.

Now, a curious fact is USD rocked up, EURUSD plunged everyone awaiting for S&P to plunge AAANND... nothing.

What I've said many times before in here that I was expecting was that Dollar, etc could go in their 1st wave down (EURUSD) or up (dollar index), while the stock indexes remained intact. My view was, these assets (currencies) could lead on the way down on their first waves and then rebound for their Wave 2  correction and stock indexes getting their tops during a lower high in currencies. It's pretty common since no asset has 100% correlation. The same happened in 2008 with oil, indexes and currencies. EURUSD topped when indexes were making their minor wave 2, while Oil topped when indexes were making their intermediate 2.

It would look something like this:


 I think I made my point. We'll see what the new year brings. But my opinion it will be what most don't want. I think 2010 will be much more like 2008 than any other year. But that's just me...

Tuesday, December 15, 2009

Very late update...

I apologize for the very late update but I was a bit busy lately so I didn't have much time focusing on doing an appropriate update.

In regards to the indexes, not much has been going on... We've been in this boring range tight market for almost 2 months. What I said before still stands. We should be rolling over soon.

In fact, the dollar seems to have changed to the beginning of an uptrend. This reinforces the possibility of the indexes following suit soon.


EURUSD has definitely changed the trend... in fact wave 5 seems to be extending. Euro may find support in the 1.43xx area.

USD Index seems to have broken out of the downward channel it had been for almost 5 months. It also broke it's Long term trendline. Add this to the fact that the Elliott Wave Structure looks complete now, it has a very high degree of possiblity to begin quite a rally here.

First target will obviously be the 221 MA.

Although USD Index is very correlated to the indexes it doesn't mean they move in exact tandem. In EW terms for example USD Index could now be in the beginning of Wave 1 up, while the indexes (S&P and DOW) are in the midst of the final wave. This happened in 2008 in a lot of assets (ones being already in wave 1 down while others still upward). EURUSD for example should correct soon a bit, this could be a catalyst for new highs on the indexes (for their final wave) while Euro failing to make new highs (which i find very unlikely).

Gold and Silver seem to have started the downward move as well....


To me, this seems to be the long term picture...

EDIT

Also we're almost making changes in our LM Portfolio. Again, if you followed the portfolio, I hope you took my hint of starting the portfolio on November 1st due to seasonality. Long term, it shows that buy ins starting November have a statistical edge over other periods. It may not happen one year or another but long term it seems to be this way, so this was the reason on my own portfolio I did the same as I stated before the September 26th buy in.

This seasonality chart shows the reasoning behind it:

   As you can see, most the buy calendar periods fall in either trending up periods or after a big correction (August-October period).

I will go further in detail on this, once we make an update of LM Portfolio

Monday, December 7, 2009

Coawabanga...

Hello everyone. Not much to add regarding the indices front. They remain at the same juncture pretty much and long-term I am still bearish. There are a few developments though in other assets like EURUSD, Gold, AUDUSD and the Dollar Index, which to me is becoming the most relevant asset to merit a close watch. As I said a few weeks ago, it's all about the dollar...

S&P remains the same juncture... just under the 50% Fib and look at the divergences going on - this is a different indicator than the last few weeks:

 EURUSD sports the same divergences, and also broke the trendline that was supporting it a few days ago...

 Add that to the major sell off last week, but most importantly the characteristics of the sell off... Classic textbook Elliott Wave form with 5 waves down as you can see in the picture... so at least a deeper correction is on the cards... a correction would dump EURUSD into the 1.43 area, while a reversal would be the start of the decline under last year's low.


AUDUSD has many resemblances to EURUSD. In fact, AUDUSD was the first pair to sport 5 waves down a week or more ago if I recall correctly. This too, should have more downside potential. A trading plan here, alike EURUSD would be to short on the rallies like a 38 or 50% Fibonacci retracement of friday's decline.

Now, let's move to GOLD. That little shinny yellow object that most of us love. Who doesn't ? :-D

Anyways, here to we have MAJOR divergences, and for the first time in a long time we have a textbook Elliott Wave form decline, sporting 5 waves down. It can't get cleaner than this. Again the plan here would be to wait for a little rally into the 38-50 Fibonacci area and then getting in.


Oh I almost forgot... one more thing. Remember my charts on USD Index? I've been favoring a big rally coming on USD. Lately, it seems USD has found a bid. Let's see if it can continue this strong. It's imperative to remain strong and break those resistances. But here's what I prep for you guys...

An ABC flat looks like this:


Now let's take a  peek into USD Index...


Now tell me I'm not seeing things... any resemblance with real life is purely coincidental. :-D

EDIT:

I want to make an update on something I forgot to talk about. Last Friday's Non-Farm Payrolls. I saw a lot of cheering because the report was so much better than expected and how the unemployment dropped from 10.2% to 10%. Well, I don't see a reason for cheering such numbers. And why is that?

We have to take into account the season we're in. I don't know how it is in USA - well actually I do - but here in Portugal, stores during November start to recruit a lot of workers for the Christmas season, but then what? They get dumped in January pretty much. So I don't see much reason to cheer... the drop in the numbers of NFP were ONLY because of the hiring due to the TEMPORARY hiring companies ensued for Christmas. Wal-Mart alone accounted for the creation of around 65,000 temporary jobs! So we know how this will be once all those temp workers get dumped for unemployment again...

And we all know how BLS tracks unemployment figures ... here's something you should watch:

Are you unemployed?

Monday, November 30, 2009

Distribution keeps ongoing...

Just as the title says, the sharks in the ocean are distributing the hot potato to the little fish.

Let me be blunt, topping processes do take more time than bottoms actually. While bottoms can happen in a spike or so, tops usually don't. The reason is people tend to pertain on hope, so while there is still hope from the intervenients there is a struggle in the prices.

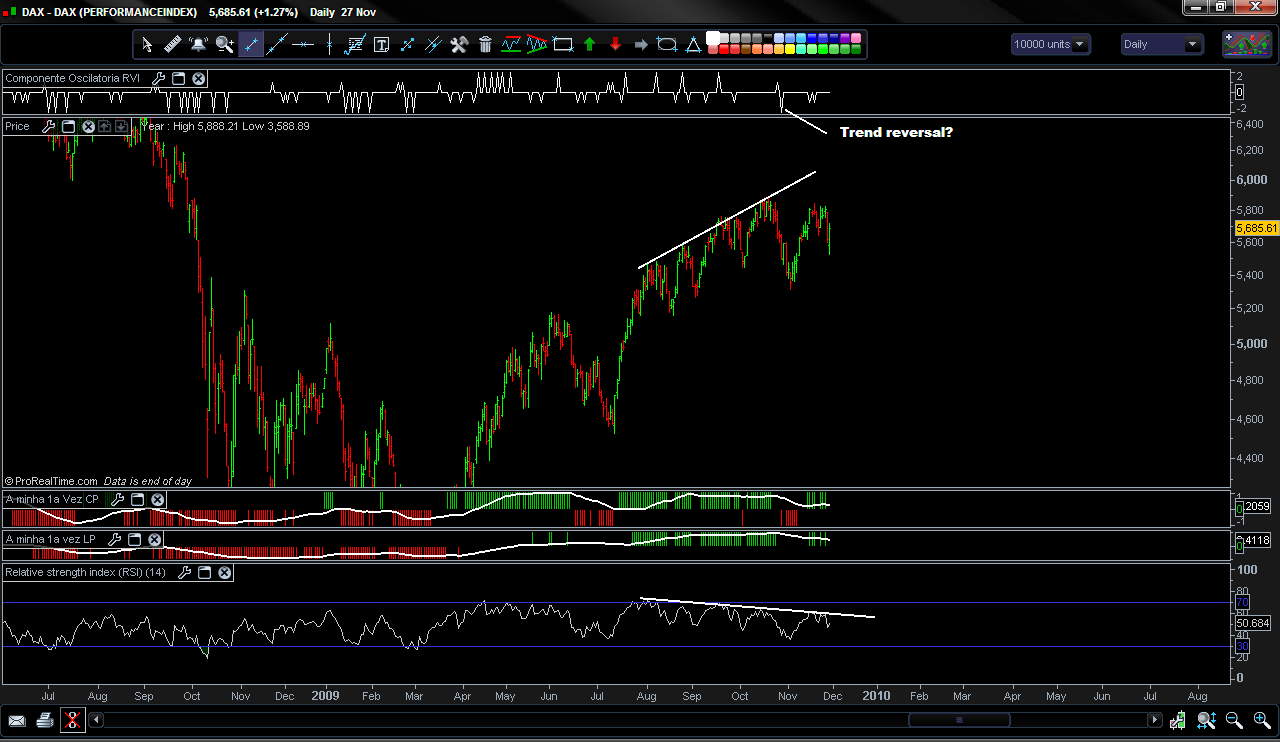
What I see in most indexes is actually topping patterns. Let's make a quick summary of the world's indexes.

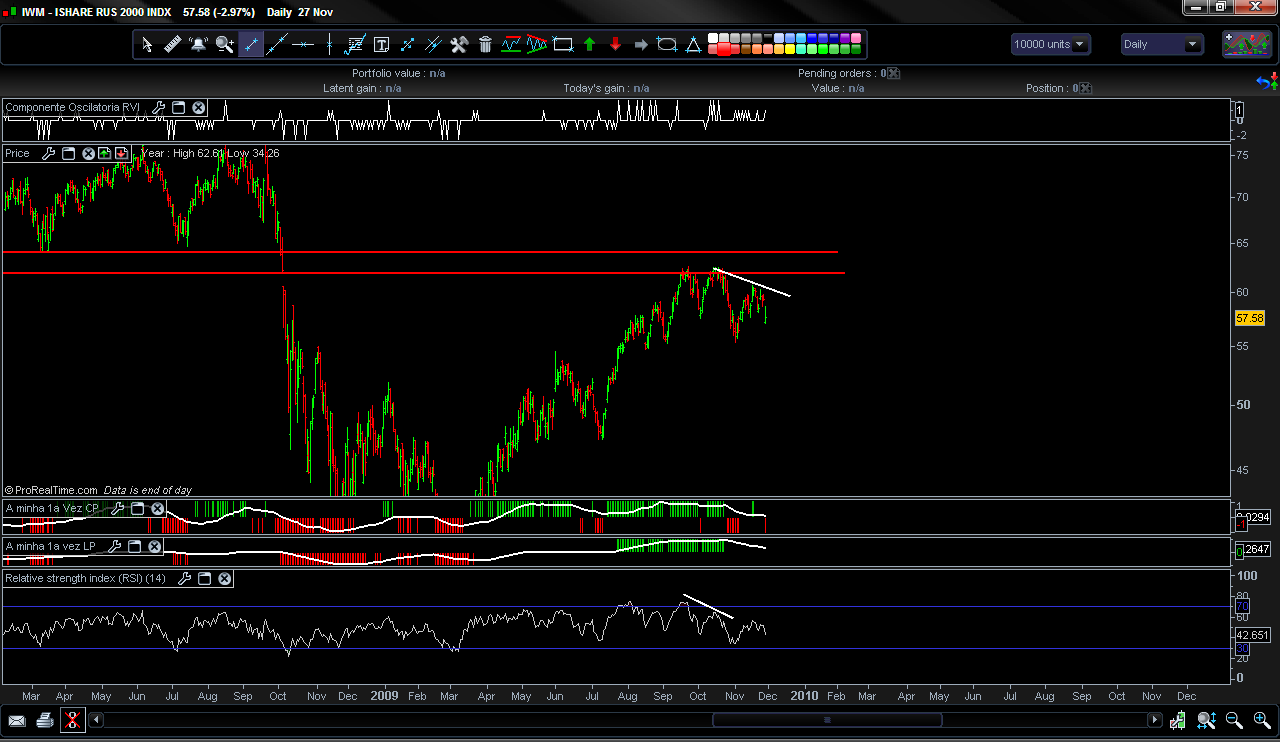
Pretty much all indexes remain lower than their highs from October. This stands true for ALL indexes except for S&P, Nasdaq and Dow Jones Industrials. Every other index is making lower highs and lower lows now.


This stands true for Russell 2000 and Dow Jones Transportation. Take special attention to the major divergences going on, especially in the indices that still haven't activated them (NQ, SP and DJI).

If we take a little road trip around the world, we'll see the same things as Russell and DJT. From Europe to Asia all indicates the same:


The curious thing is, the index that carried both S&P and NQ to new highs was the DJI. Remember in October when we had that strong sell off, and the DJI was able to maintain strong during the drop? Well now, the DJI is way higher than it's high in October while both SP and NQ are pretty much in tandem with that October high. Curious thing is while DJI was making highs after highs, 75% of the 30 components that make up the Dow Jones Industrials are (guess what?) still below their October highs ! Can we say big big divergence? You can figure it out why this is the case... the Dow calculation is something utterly stupid (the companies that have more weight in the index are the ones that have higher share prices instead of their total value...go figure).

Cheers

P.S.: Don't forget to have a look at http://friendly-traders.blogspot.com/ ... there's a nice database of programs there :-)

Monday, November 23, 2009

Swine What?


Indeed... Your beloved host is the latest victim from those piggy bastards. Hence the lack of posting during this weekend. Last night I spent 5 very boring hours at the hospital only to arrive home at 2AM.

I will try to do a more thorough analysis throughout the day. You know where I stand, I think we are close to rolling over, and Ze' Manel already issued a sell signal. So far futures are ramping higher, but there's a nice little graph from Fujisan, a guest host from SOH, and she is very knowledgeable and I've learned a great deal from her posts. I found this graph very interesting.


It seems peaks have been happening at New Moon dates and bottoms around Full Moon dates. I'm not much into these kind of cycles, but I know new/full moon cycles have a very good hit rate in statistic terms, so I guess there may be something going on there...

Friday, November 20, 2009

Rolling over?

S&P rolling over?

 For the first time since the bottom at 1030's a few weeks back, we now have a sell signal. Let's see how this one develops.

Meanwhile the dollar is strengthening. Today there was a glitch shooting the USD Index up almost 10%. I wished it were true I'd be up like 200% in a blink of an eye eheheh...
Anyways, here too the bottom seems to be rolling up.

A lot of divergences going on, extreme bearishness from the public and market participants, and also the EW count calls for a move up. As you know I am expecting a big rally for USD, maybe as strong as +50% on the Index.


Of course, although I'm very bullish on the dollar I will only start buying once it passes through the 76 area or whenever I get a signal from my systems (which on the short term I already am long the dollar).

Monday, November 16, 2009

Weekend update

Not much to add after last week. We're still under the 1100 resistance area in the S&P500. In EW terms, I cannot make at this juncture a count.

There are times when we need to step back and wait a bit, for more information in order to make a correct assessment. Trying to force perspectives into our counts is foolish. One should know when to step back and admit that for now there's no need to try to come up with a count that has a low reliability.

To me, we're still in a topping process, especially with the recent market correlations that are kind of broken right now. I'm talking DAX and other european indexes, as well as the higher beta US indexes such as the Dow Transports and Russell 2000.

DJT is considered to be the leader of the market, and so far it has struggled and is still far away from its' highs. This week is utterly decisive.

As far as Ze Manel goes, well stay with the trend... this is an intraday chart:

These are the German DAX and the PSI-20 (the portuguese index)... both are more than lagging the current uptrend on the S&P and the DOW JONES.


 As far as the higher beta US indexes go, here's a snapshot of Russell 2000


Cheers!

P.S: I want to thank you for the adherence to EWI's free week. Definitely I wasn't expecting such a surge on participation. I hope you all took advantage of it and gathered some of their premium services. Don't worry, now that it's over you still have a lot of free stuff inside their members page, so to all of you that missed it you can still register and have access to their free stuff. And the free week from EWI is a common occurrence from them, so keep your eyes open.

Live Economic Calendar Powered by the Forex Trading Portal Forexpros.com
Disclaimer: The information provided on this website, while timely, colorful, and accurate, is not to be taken as financial, legal, tax, psychological or any type of advise. The purpose of this website is to track the progressions of human herd psychology as it is reflected through several financial markets. Any commentary on this page, however useful it may be, is used for illustration, and to inspire thought provoking discussion, and not to be taken as specific trade recommendations. We are not endorsing any site or service, nor are we promoting choice examples as real-life trades. If it sounds sarcastic, it probably is and if it offends you, just don't read it. There are tremendous inherent risks in attempting to trade any market using any vehicle, particularly if it is leverage. Please contact your broker to explain all risks involved in the vehicle you will be trading and any questions you may have.

Back to TOP