There have been some worries on what could happen to LMP in case of a market meltdown.
Well, to be blunt, I would expect them to get decimated along the market of course. What we could do though, would be to whenever Zé Manel gave a sell signal, we could expose ourselves just to the alpha of LMP portfolio. What does this mean?
Simply it means that we would be "betting" on the outperformance of the portfolio versus the S&P500 even if the portfolio were to decline, if positive alpha was achieved, it would make money.
Alpha simple stating is the outperformance above the broad market that a manager/investor can create to a portfolio. So if someone would've gained 15% on his portfolio while the market gained 10%, it was said that the alpha would be +5%. Of course on any given year, this measure is useless. What is really valuable is a consistent positive alpha from managers or portfolios. This means one could go for a market neutral strategy such as being long the portfolio while short the broad market, and absorb the alpha return on itself and either make money or lose much less than the market.
Outperformance could either be a better performance on the positive side (+15% vs. +10%) as well as on the negative side( for example the manager losing -15% while the market losing -25%: this is a +10% alpha).
So what would be the most convenient, would be to be exposed both to the market returns + the alpha given by the manager whenever the market as broad is bullish and whenever it's bearish we would want to be only exposed to the alpha.
While I still haven't backtested this idea, by using Zé Manel, I'm confident it may give back positive results.
Also, I'm working on a strategy that I've been having on my mind for quite sometime... We would be using Ze' Manel as well in order to time diferent indexes and so far the results look promising, although the resolution of the backtest so far is yearly only, I will provide soon enough results with more resolution with weekly data points, in order to have better measures on drawdowns, etc.
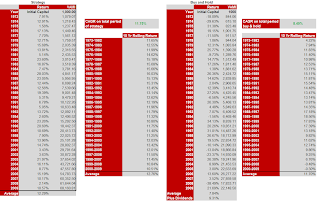
The returns though, clearly look much stronger than a passive buy and hold on the market including the dividends paid.
There is a problem for a person to remain disciplined with this strategy. As you can see, the average return of the strategy is very very stable both on arithmetic average as well as on CAGR.
Also take a look at the 10 year rolling period returns. Both on buy and hold and the strategy. The strategy would've underperformed during most of the 90's. Would you have stuck with the strategy at that time? The main secret here is not to gain big... it's to maintain a stability and not to lose much when bad times come around. Also the buy and hold returns during the 90's, I would say they are difficult to be repeated as it was the biggest bull market in human history... Well, at least I don't expect such euphoria anytime soon. And stability pays off... check the last 10 year rolling period which stands for the annual returns for the 2000-2009 period.
The 10 Yr Rolling returns, are much more realistic from an investor standpoint since investors don't invest all at same time, and a high CAGR could be due to early big gains on a time series. For example look at Warren Buffet. His long term return is 22% a year. Does this mean people investing on him would achieve that? Not likely, most of that 22% return is concentrated in his early days and a 10 Yr Rolling period is much more transparent when it comes to assessing the robustness of an investing strategy and what an investor could expect in a long term investment of 10 years for example beginning at anytime (although past performances are no guarantee of future performances of course).
VAMI is simply the Value Added Monthly Index, and tracks an hypothetical $1000 investment at the beginning of the period. In this case $1000 would have turned into $68,000+.
Of course since the risk adjusted returns are way bigger on the strategy, so one could leverage it up 1.5x or even 2x's. Although the drawdown would be bigger than the one from unleveraged, this would still be about less than half of the S&P. I mean most people in 2008 suffered through 60% drawdowns, isn't that nerve wrecking ?
Even if a strategy doesn't make as much CAGR as buy and hold (which this does more actually), wouldn't you rather have a 9-10 annual return with much lower downside, than have 11-12% returns with chances to watch your account being cut in half ?
I know I would...
Monday, May 17, 2010
blog comments powered by Disqus
Subscribe to:
Post Comments (Atom)
Live Economic Calendar Powered by the Forex Trading Portal Forexpros.com


