Today was a holiday here in Portugal. The day where Portugal turned from a monarchy into a republic. October 5th of 1910, one year short of a century.
It was not until a year later that my great grandfather would become the 1st elected President of my country. True story!
Apart from that, let's check the S&P. This little decline somehow feels different, the bulls have been really cocky the past couple days, and are pretty sure we'll see new highs. I don't say that's impossible, but the fact that the mood is different makes me thing otherwise. Also a few charts look different was well.
Zé Manel also gave a SELL signal past friday on the daily charts- which the last time it did was June 16th, and the wedge is more than broken right now and I wouldn't be surprised to see the index go test the underside of the bottom of the wedge...
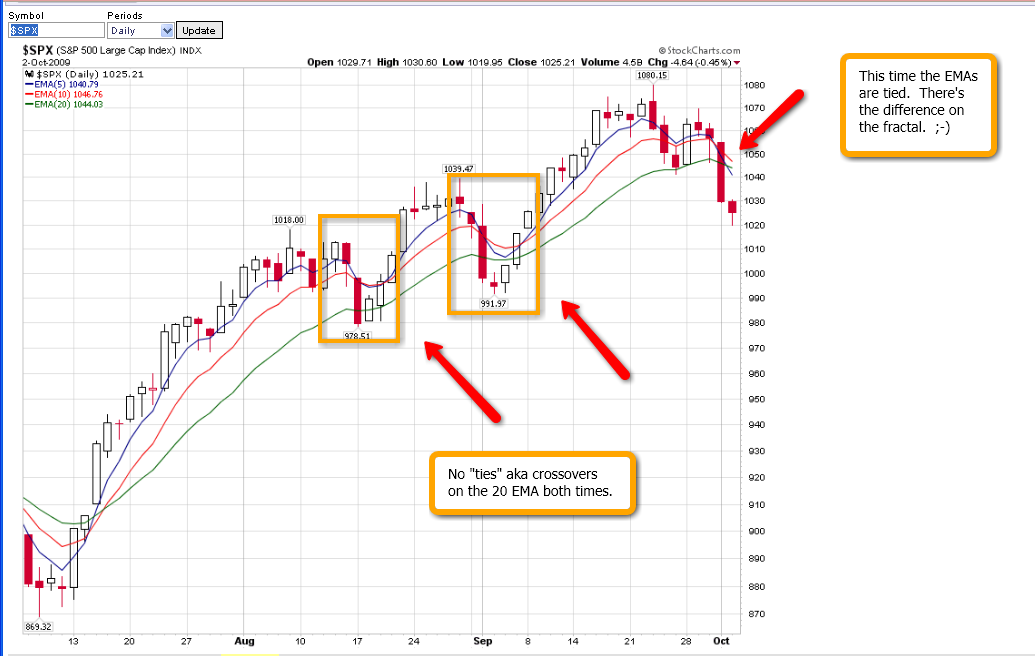
Also take a look at the last chart at the bottom, from Mole at
EvilSpeculator. Something different in the cards? I don't know, just putting ideas on the table... also if anyone would want to know Zé Manel system would indicate to go short at market with a stop at 1071'ish.
Don't get me wrong, I'm not saying it's impossible to go higher, I actually am very cautious on both sides, although I would lean a bit more into the bearish case, even if we rise a few more points in order to test the broken trendline.
Cheers everyone